Green Island
Analyzing and combating Urban Heat Islands in Patna through data-driven solutions
Our Mission
We're dedicated to understanding and addressing the rising temperatures in Patna's urban areas. Through satellite data analysis and ground-based measurements, we identify heat islands and propose effective green solutions.
Key Features
- Real-time temperature monitoring
- Vegetation density analysis
- Interactive heat maps
- Green intervention recommendations
Impact
Studies show a 6.88°C increase in Patna's surface temperature between 1990 and 2022. Our platform helps visualize this change and suggests data-driven solutions for a cooler, greener future.
Urban Heat Island (UHI) Data Visualization
Key Observations:
- 1990: Low urban spread, more vegetation, less built-up area.
- 1995: Initial signs of urban expansion; moderate heat rise.
- 2000: Construction and infrastructure growth increases.
- 2005: Industrial zones begin expanding.
- 2010: Dense settlements, commercial growth accelerates.
- 2015: LST increases in central city areas due to loss of green cover.
- 2020: Peripheral areas start showing UHI effects.
- 2022: Max rise observed; ~6.88°C rise since 1990.
- 2024 (Estimated): Urban saturation, minor green interventions begin.
⚠️ Warning: The temperature rise is alarming! Immediate mitigation is needed.
Reference: Kumar, R., et al. (2022). "Analysis of Urban Heat Island Effect in Patna Using Remote Sensing Data."
The Urban Heat Island (UHI) effect is a phenomenon where urban areas experience higher temperatures than their rural surroundings due to human activities, reduced vegetation, and heat-absorbing surfaces. This visualization helps identify "hot spots" and areas that could benefit from increased greenery or reflective surfaces.
Data sources: Landsat 8, Sentinel-2, and local weather stations. For more details, see the project documentation and methodology.
Bihar Air Quality: Patna vs Champaran
Patna City Urban Heat Map
Urban heat maps highlight the rising temperatures in cities due to factors like reduced vegetation and increased urbanization. Below are some key indicators for Patna City:
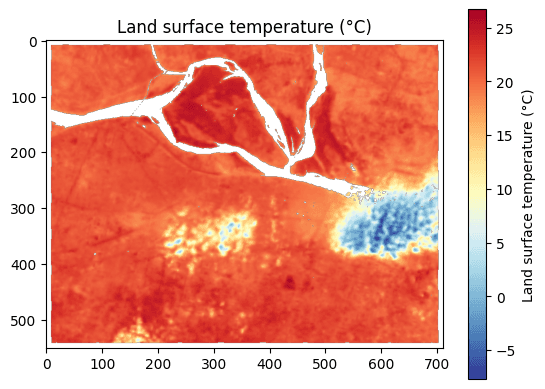
Land Surface Temperature
Rising land surface temperatures contribute to urban heat islands, impacting the environment and public health.
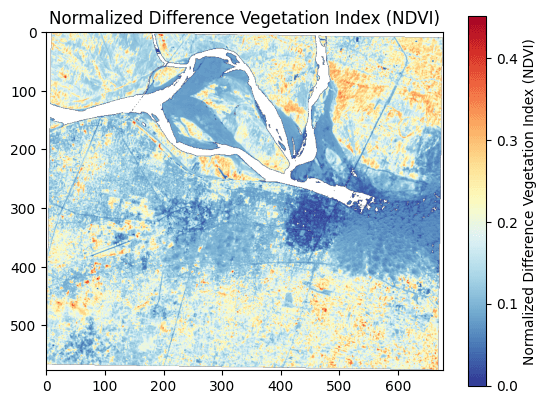
NDVI (Normalized Difference Vegetation Index)
NDVI measures vegetation health. Reduced vegetation in urban areas exacerbates heat retention.
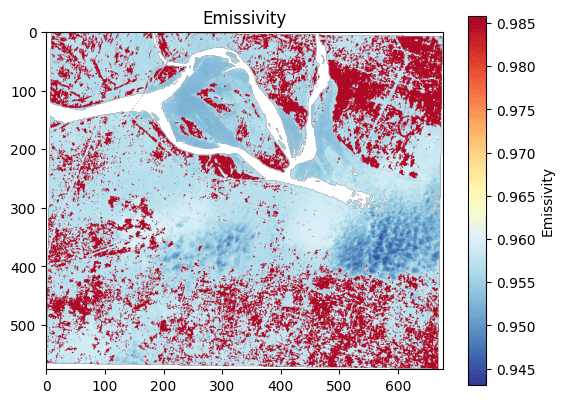
Emissivity
Emissivity indicates the efficiency of surfaces emitting heat. Urban materials often have higher emissivity.
Harmful Effects
- Increased energy consumption for cooling.
- Higher air pollution and greenhouse gas emissions.
- Adverse health effects, especially for vulnerable populations.
- Reduced water quality due to thermal pollution.